


Gramener – Analytics and Business Intelligence
“COHERENT CONSUMPTIION of DATA” – Solve this classical problem across enterprises.
Gramener offers a platform for effective Data Visualization ( Visual Analytics) . The product helps businesses visualize their data for rapid insights & decision making
The Gramener Visualisation Server is a revolutionary product that transforms large-scale data into concise visualisations in real-time without human intervention that make business problem and solution visually obvious.
Based on subjective research, our clients benefit by finding insights quickly, and our visualisations guide the end users towards actionable decisions. The end result also helps enterprises effectively consume data through visualisations which help align mental models amongst all the stakeholders.
The technology is based on a combination of design, statistics and programming. The visuals are based on cognitive research and presented in a visually appealing and actionable way. The analysis identifies hidden correlations and predicts trends for the future. The product can connect to heterogeneous data sources. The entire process of visualisation is automated, and requires no manual effort.
The Challenge
Today, more information is produced every year than the entire history of human civilization did until 2000. This offers a unique opportunity – the ability to use this information to intelligently guide us.
It also poses a challenge: how does one understand such vast quantities of data – which are well beyond most supercomputers’ comprehension, let alone the human mind?
From an enterprise perspective, even after investing heavily on data generation and data management, businesses are still failing to consume all the data that they have control of, to make right decisions across various functions of the businesses.
How Gramener addresses the challenge
Using Gramener’s product with built in analytics and modern visualizations (such as treemaps, calendar map, sun bursts, Sankey etc.), over 150 pages of productivity reports have been compressed into a single sheet without loss of information or insight. With animated visualizations, 100 years of weather data has been compressed into half a minute video. Predictive algorithms are able to determine which individuals will cease to be customers, or catch a disease, or are likely to buy a product, with considerable accuracy. New techniques integrated in to the product helps to rapidly analyze data at unprecedented speeds and scale.
Gramener addresses the essential need of making the consumption of data – simpler, coherent across organizations and rapid.
The product is capable of solving various domain vertical and functional problems for example:
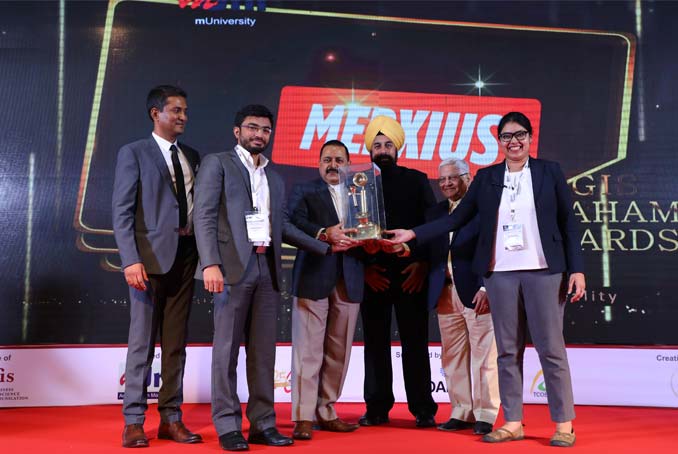
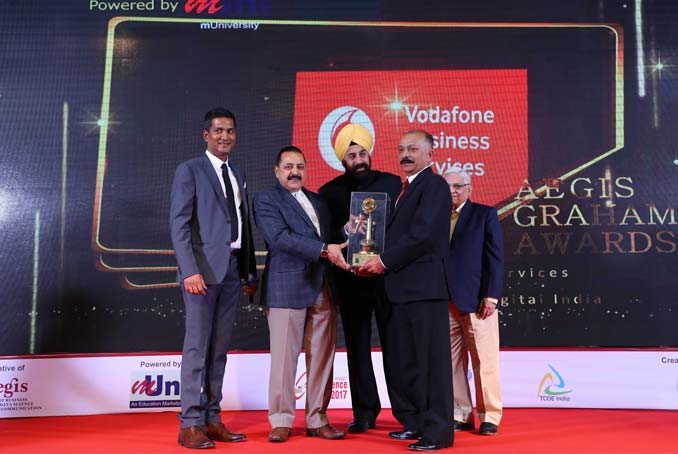
For a telecom company, Gramener’s visualizations helped their marketing function by analyzing the data collected from diverse customer segments and helped in making right marketing decisions for retention of customers.

